MBTI Sentiment Analysis
A Sentiment Analysis over different Myers-Briggs Personality subreddits
Introduction
Sooo… at some point in my adolescence, like many other people I guess, I took the 16 Personalities Test. Once I saw the results, I clearly remember this feeling of being understood: matching my characteristics with an abstract model shared by other people made me feel part of a crowd, even without actually seing it.
Years later - don’t even remember how - I literally became obsessed with this personality classification, spending my whole summer reading about it and discovering a world behind it. The more I read and learned, the more I was fascinated. I started trying to type people around me and matching their actions with my expectations based on that. This also gave me a sense of protection: I finally had a tool to model others, and that would have reduced the uncertainty!
Well.. I had become a little too obsessed, to the point that I couldn’t filter out the model from reality anymore. So I decided to quit.
Fast forward: now that I’m an older oldie, I’ve decided to hug that little girl and start an MBTI-based investigation, using the new tools data analysis gave me. In particular, this project aims at answering the following question:
Is there a correlation between Myers-Briggs type and the sentiment expressed in written comunication?
The data
To perform any kind analysis, we first need data. Better if a lot of them.
There’s a big Reddit world for Myers-Briggs fans. In particular, there’s a subreddit for each personality type. You don’t need to test as a particular personality to write on the corresponding subreddit, but from an empirical observation I saw that this is what happens in most of the cases. Therefore, I applied the analysis on subreddit posts, with the approximation of labeling them as written by the associated personality. If you want to be more precise, you can change the original question in:
Is there a correlation between Myers-Briggs subreddit and the sentiment expressed in its posts?
Sentiment analysis
To perform the analysis, I used the following models.
- DistilBERT base uncased finetuned SST-2 , to obtain a positive and negative score for each post.
- Distilbert-base-uncased-emotion, to get post scores over the following emotions: love, joy, anger, sadness, surprise and fear.
Type analysis
For each personality type, I aggregated the scores obtained for each emotion, and computed the average value. I also assessed the percentage of posts classified as positive and negative (based on the higher score in the sentiment measure). Here are some interactive graphs displaying the results: you can view the emotion and sentiment values for each personality type by selecting it.
The obtained values were then compared across different personality types, and the differences are shown in the following graphs.
It looks like ISFJ and ESFJ tend to have the highest love scores, while INTP has the lowest. Expression of joy appears to be relatively uniform across personality types, with a slightly higher score for ESFP. According to the analysis of text data, ESTJ posts convey the highest anger score on average, while INFJ posts the weakest. INFJ posts have, on the other hand, the maximum sadness and surprise scores. INFP posts manifest the highest value of fear, while ENTJ ones the minimum across all personalities.
Of course these results should be interpreted with caution, as they are based on a limited and contaminated sample (let’s remember that posts are not necessarily written by the corresponding personality type). With that being said, I find them broadly consistent with what is known about the corresponding personality types.
The ISFJ (Introverted, Sensing, Feeling, Judging) and ESFJ (Extraverted, Sensing, Feeling, Judging) personality types are known for their strong feelings and emotional sensitivity, which may explain why they tend to have higher scores on the love emotion. The INTP (Introverted, Intuitive, Thinking, Perceiving) personality type, on the other hand, is known for its logical and analytical approach to decision making, which may lead to a lower score on the love emotion. This is confirmed by the fact that also other notoriously analytical types (like ENTP and ENTJ) tend to have lower love scores when compared to the other personalities.
The relatively uniform expression of joy across personality types is consistent with the idea that this emotion is relatively universal and not strongly influenced by individual differences in personality. However, the slightly higher score for individuals with the ESFP (Extraverted, Sensing, Feeling, Perceiving) personality type may be due to their outgoing and sociable nature, which could lead to a greater tendency to express joy in written communication.
The higher anger score for ESTJ (Extraverted, Sensing, Thinking, Judging) posts is consistent with the assertive and decisive nature of this personality type, as they may be more likely to express anger in response to a perceived threat or challenge. The lower anger score for INFJ (Introverted, Intuitive, Feeling, Judging) posts is consistent with their introspective and empathetic nature, as they may be more inclined to consider others’ feelings and avoid expressing anger.
The higher sadness and surprise scores for INFJ posts are consistent with their deep feelings and strong intuition, which may lead to a greater tendency to experience and express these emotions. The higher fear score for INFP (Introverted, Intuitive, Feeling, Perceiving) posts is consistent with their sensitive and imaginative nature, as they may be more prone to feeling anxious or fearful in certain situations. The lower fear score for ENTJ (Extraverted, Intuitive, Thinking, Judging) posts is consistent with their confident and strategic approach to problem-solving, which may lead to a lower tendency to experience fear.
The sentiment of posts on various subreddits tends to be evenly split between positive and negative, but there are some exceptions.
The INFP subreddit, for example, has a higher percentage of positive posts at 61%. It is interesting to notice that INFPs also had the highest fear score. INTJ, INFJ, ENTJ, ISTJ and ENTP (in that order) have the highest percentages of negative posts, ranging from 65% to 56%.
In the following graph, you can see the results of a clustering of different personalities, based on the sentiment of scraped text data. Each personality was represented as a vector containing the average value of each emotion and the percentage of posts classified with each sentiment. This brought to 6-dimensional vectors, which I projected in a two dimensional space applying a PCA. The following table shows how the original variables contributed to the Principal Components.
| love | joy | anger | sadness | surprise | fear | positive | negative | |
|---|---|---|---|---|---|---|---|---|
| PC_1 | 0.04 | 0.14 | 0.19 | 0.21 | 0.44 | 0.32 | 0.54 | 0.56 |
| PC_2 | 0.33 | 0.02 | 0.19 | 0.62 | 0.46 | 0.18 | 0.48 | 0.12 |
After performing principal component analysis, I utilized K-Means clustering, whose fitting indicated that the optimal number of clusters was four, with the configuration shown. It was noteworthy that the outlying clusters included INFJ and INTJ personality types, as these types are known to be relatively rare among the general population (though to be the two rarest types).
Aggregate Analysis
Upon conducting individual analysis of the various personality types, I became curious as to whether there might be correlations between certain traits (such as Extraversion) and the observed differences in sentiment expressed on different subreddits. In order to explore this hypothesis, I aggregated the personalities based on their dominant traits and functions.
Traits
The following graphs compare the differences in emotion and sentiment in the presence of a specific trait versus its opposite. You can change the trait being compared by selecting it.
In contrast to the non-aggregated analysis, for this case I did not use the average for emotions but rather a similar approach to the one used for sentiment. Specifically, I compared the percentages of posts classified as containing a particular emotion using a winner takes all approach. This means that a post is classified as expressing that emotion if the emotion value for that post is higher that the values assigned to other emotions. I chose this approach because it was a better measure for calculating the correlation.
To identify dependencies between traits and emotions and traits and sentiment, I used the following statistics.
-
Chi Squared: the Chi Squared test is a statistical test that is used to compare the observed frequencies of events or categories in a sample to the expected frequencies of those events or categories based on some theoretical expectation. It is used to determine whether there is a significant difference between the observed frequencies and the expected frequencies, and can be used to test hypotheses about a population.
I used the chi-squared test to compare the number of posts classified as positive or negative, or the number of posts classified with a particular emotion versus all the others, in the presence or absence of a particular trait. The comparison was conducted using a contingency table with one degree of freedom, so the expected frequencies were computed based on the marginal sums under the assumption of independence.
The p-value in a chi-squared test is a measure of the probability that the differences between the observed and expected frequencies could have occurred by chance. A small p-value suggests that the observed differences are statistically significant and not likely due to chance alone, while a large p-value suggests that the observed differences are likely due to chance and are not statistically significant.
I didn’t include all the computed p-values in this discussion because I found the following measure more intuitive. If you are interested in computation and results you can find them here, in the GitHub repository in which I included all the code for this project.
-
Odds Ratio: the odds ratio is a measure of the relationship between two events or categories in a study. It is used to compare the odds of an event occurring in one group to the odds of the event occurring in another group. I computed the odds ratio to compare the odds of scoring negative (or with a particular emotion) having one trait to the odds of doing so not having it (therefore, having the opposite one). An odds ratio greater than 1 indicates that the event is more likely to occur in the first group compared to the second group, while an odds ratio less than 1 indicates that the event is less likely to occur in the first group compared to the second group. You can find the odds ratio with its p values and the consequent interpretation in the caption of the following graphs.
Cognitive functions
I also investigated the relation between the Dominant Cognitive Function and the percentages of sentiment and emotions in posts. Differences are shown in the following graphs, after selecting the emotion or sentiment of interest.
Again, the results should be interpreted with care, but I could appreciate some similarities between results and what is known about cognitive functions. Specifically, it appears that individuals with Fe (Extraverted Feeling) as their dominant cognitive function tend to have more posts classified with love. We know that Fe is focused on the interpersonal and social aspects of life and involves a deep concern for the well-being of others. People with Fe as their dominant cognitive function tend to be empathetic, compassionate, and attuned to the emotional needs of others, so it seems likely that they would express more love in written communication with them. Ni dominant individuals are often imaginative, introspective, and insightful, with a strong intuition and a deep understanding of their own motivations and desires: this focus on the inner world and perception of patterns could correlate respectively with higher sadness ad surprise scores.
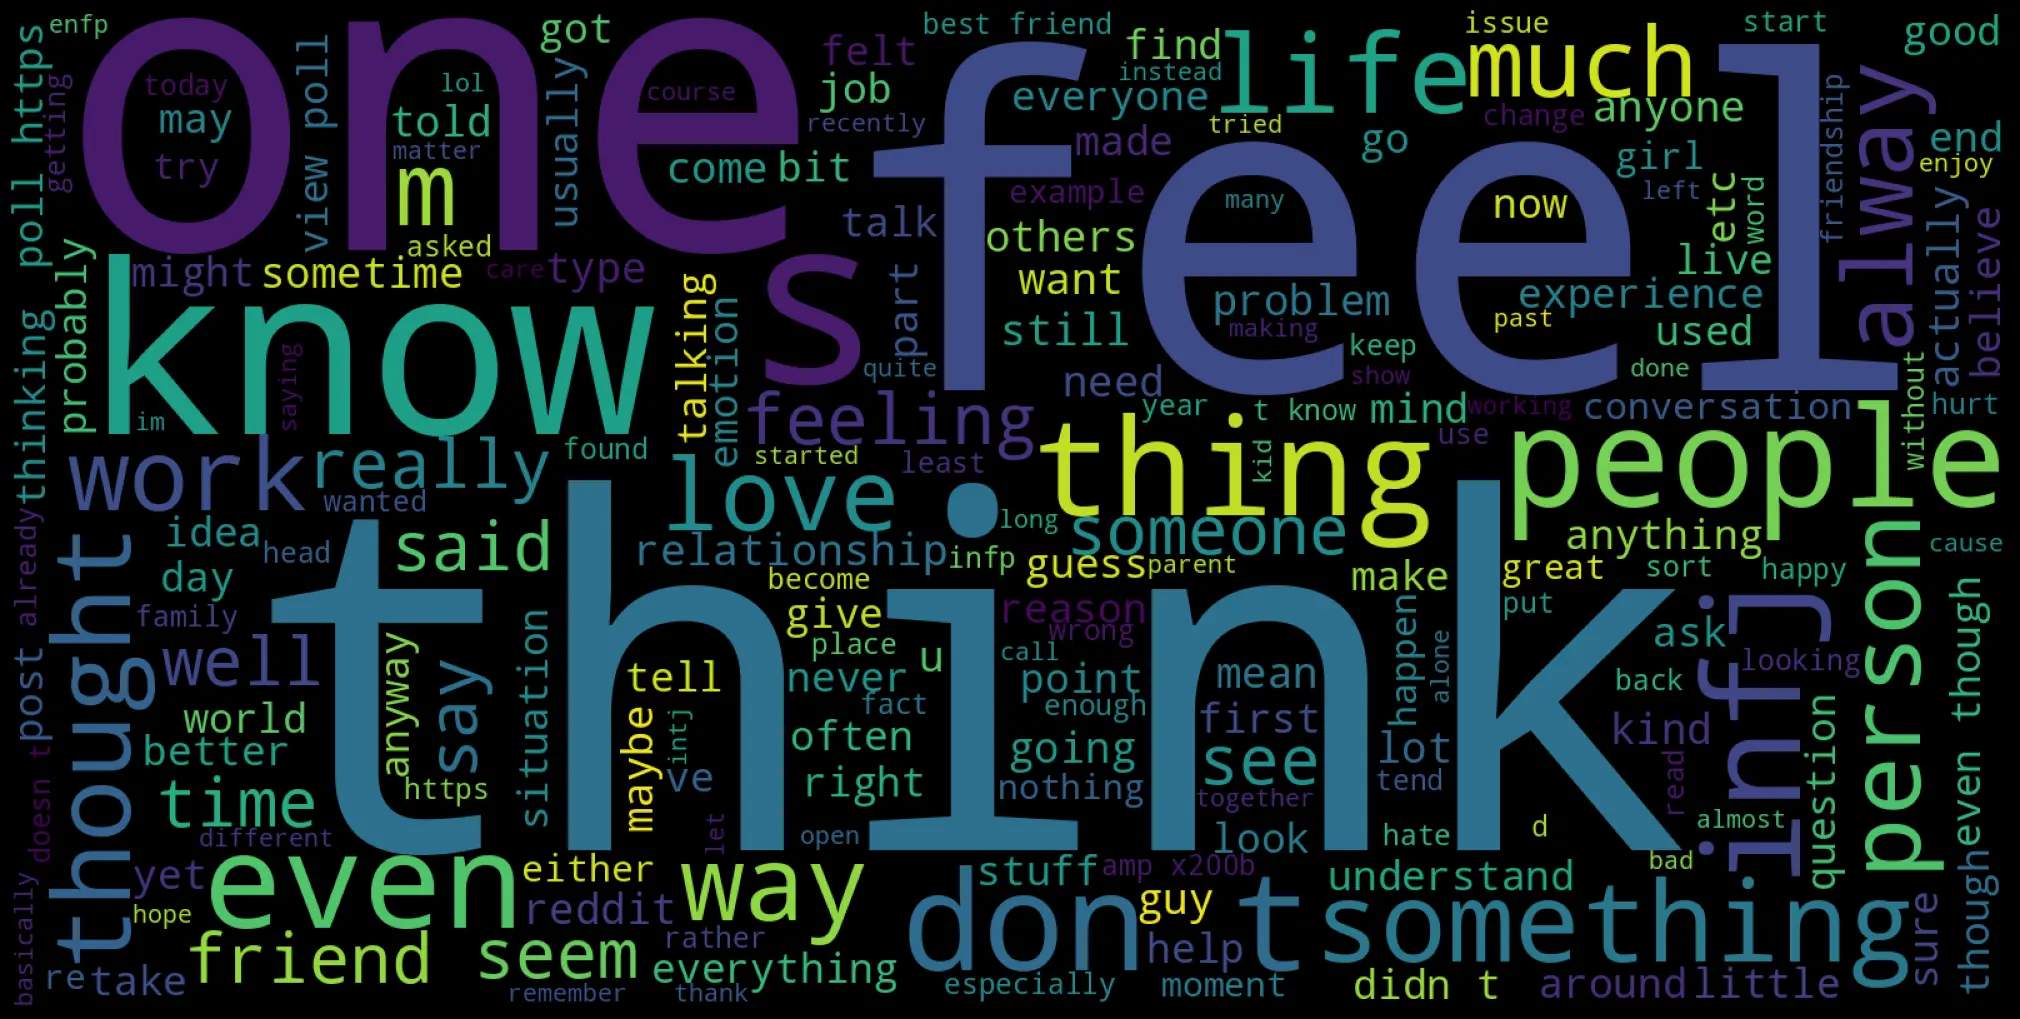
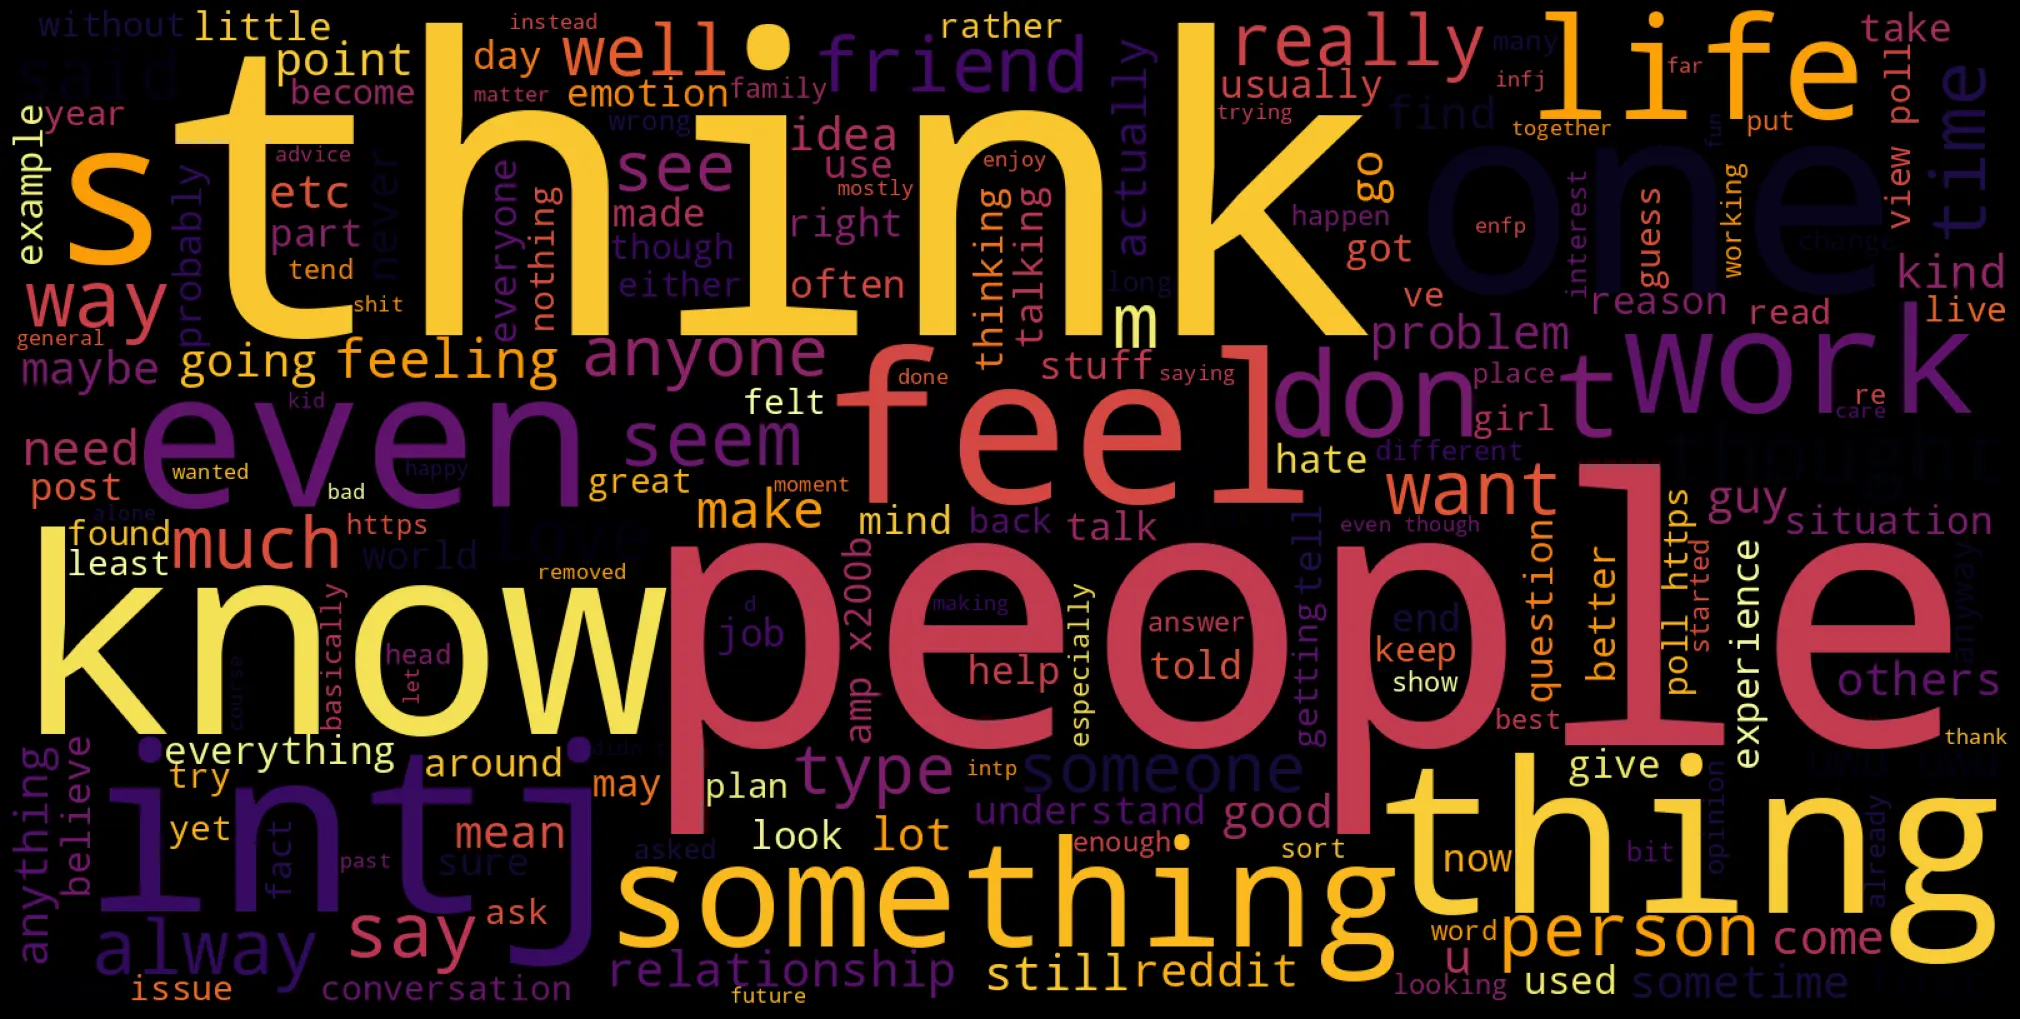
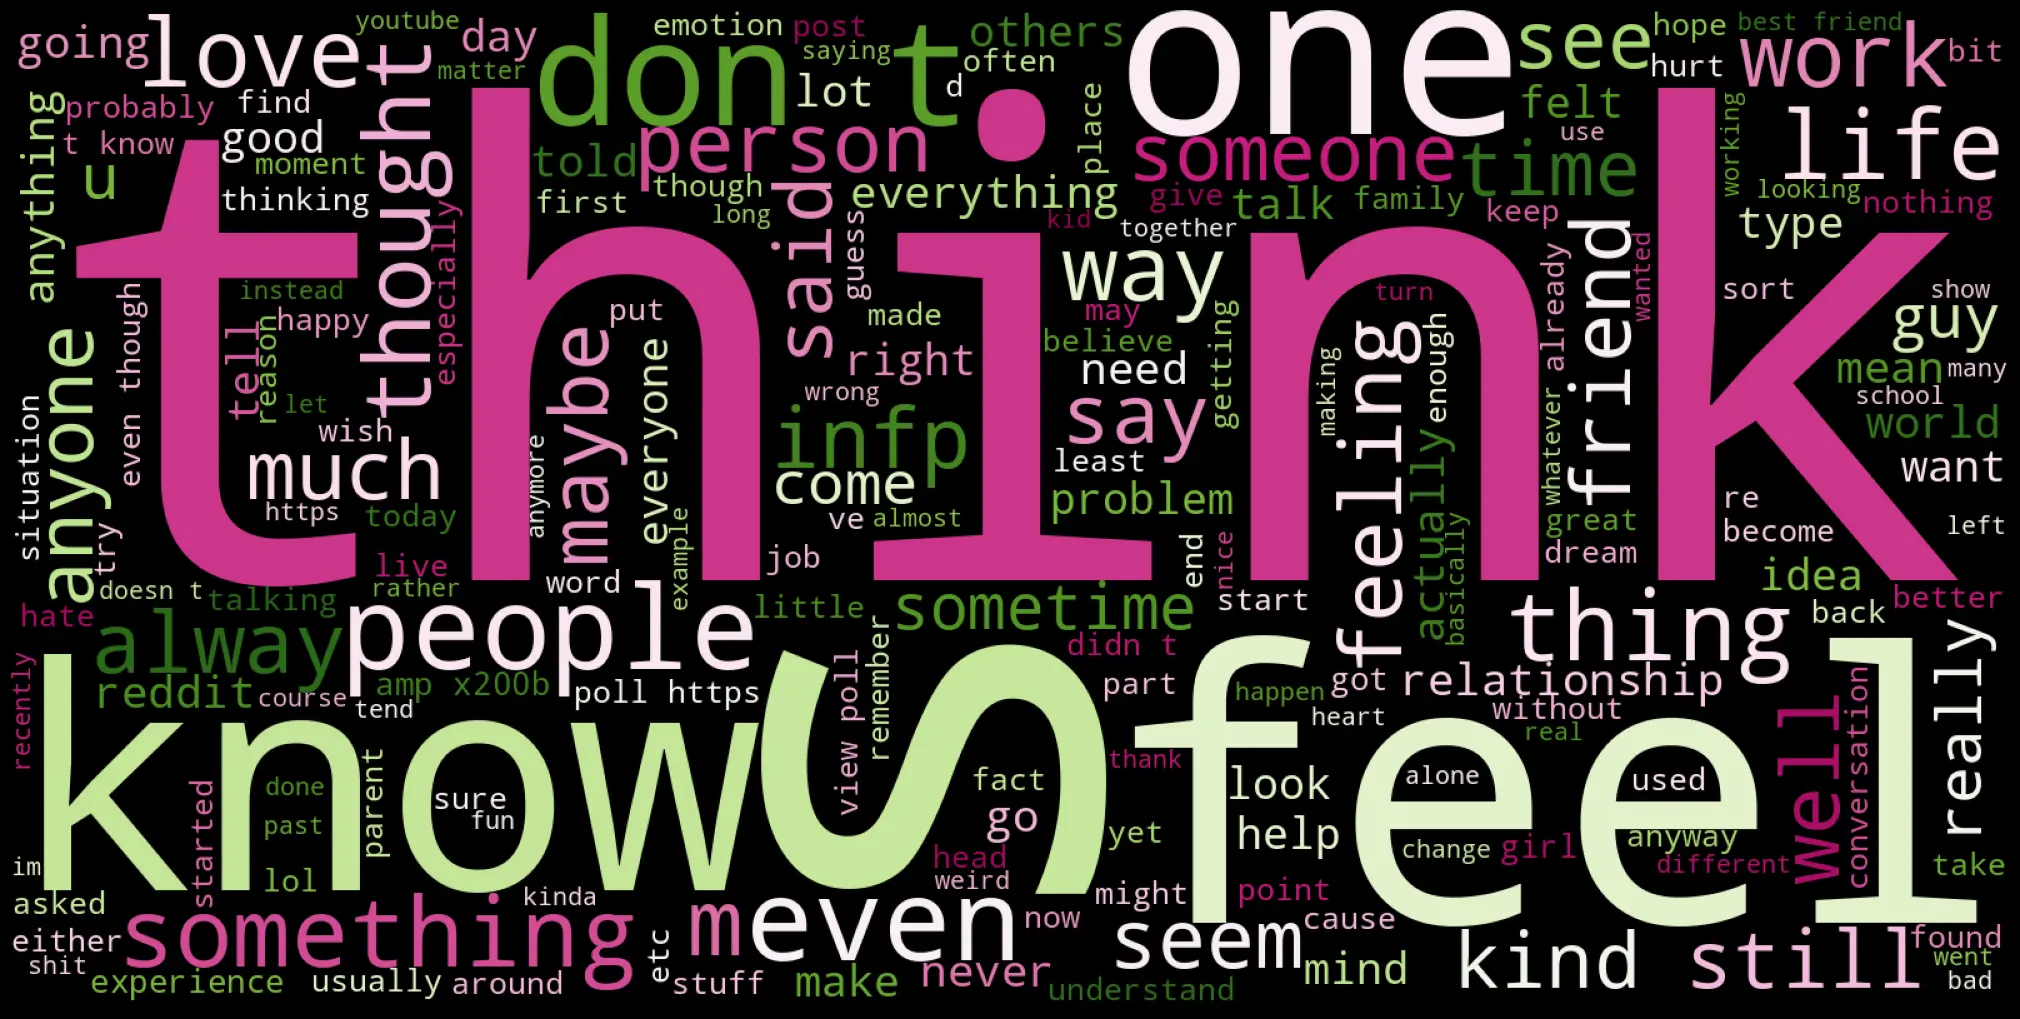
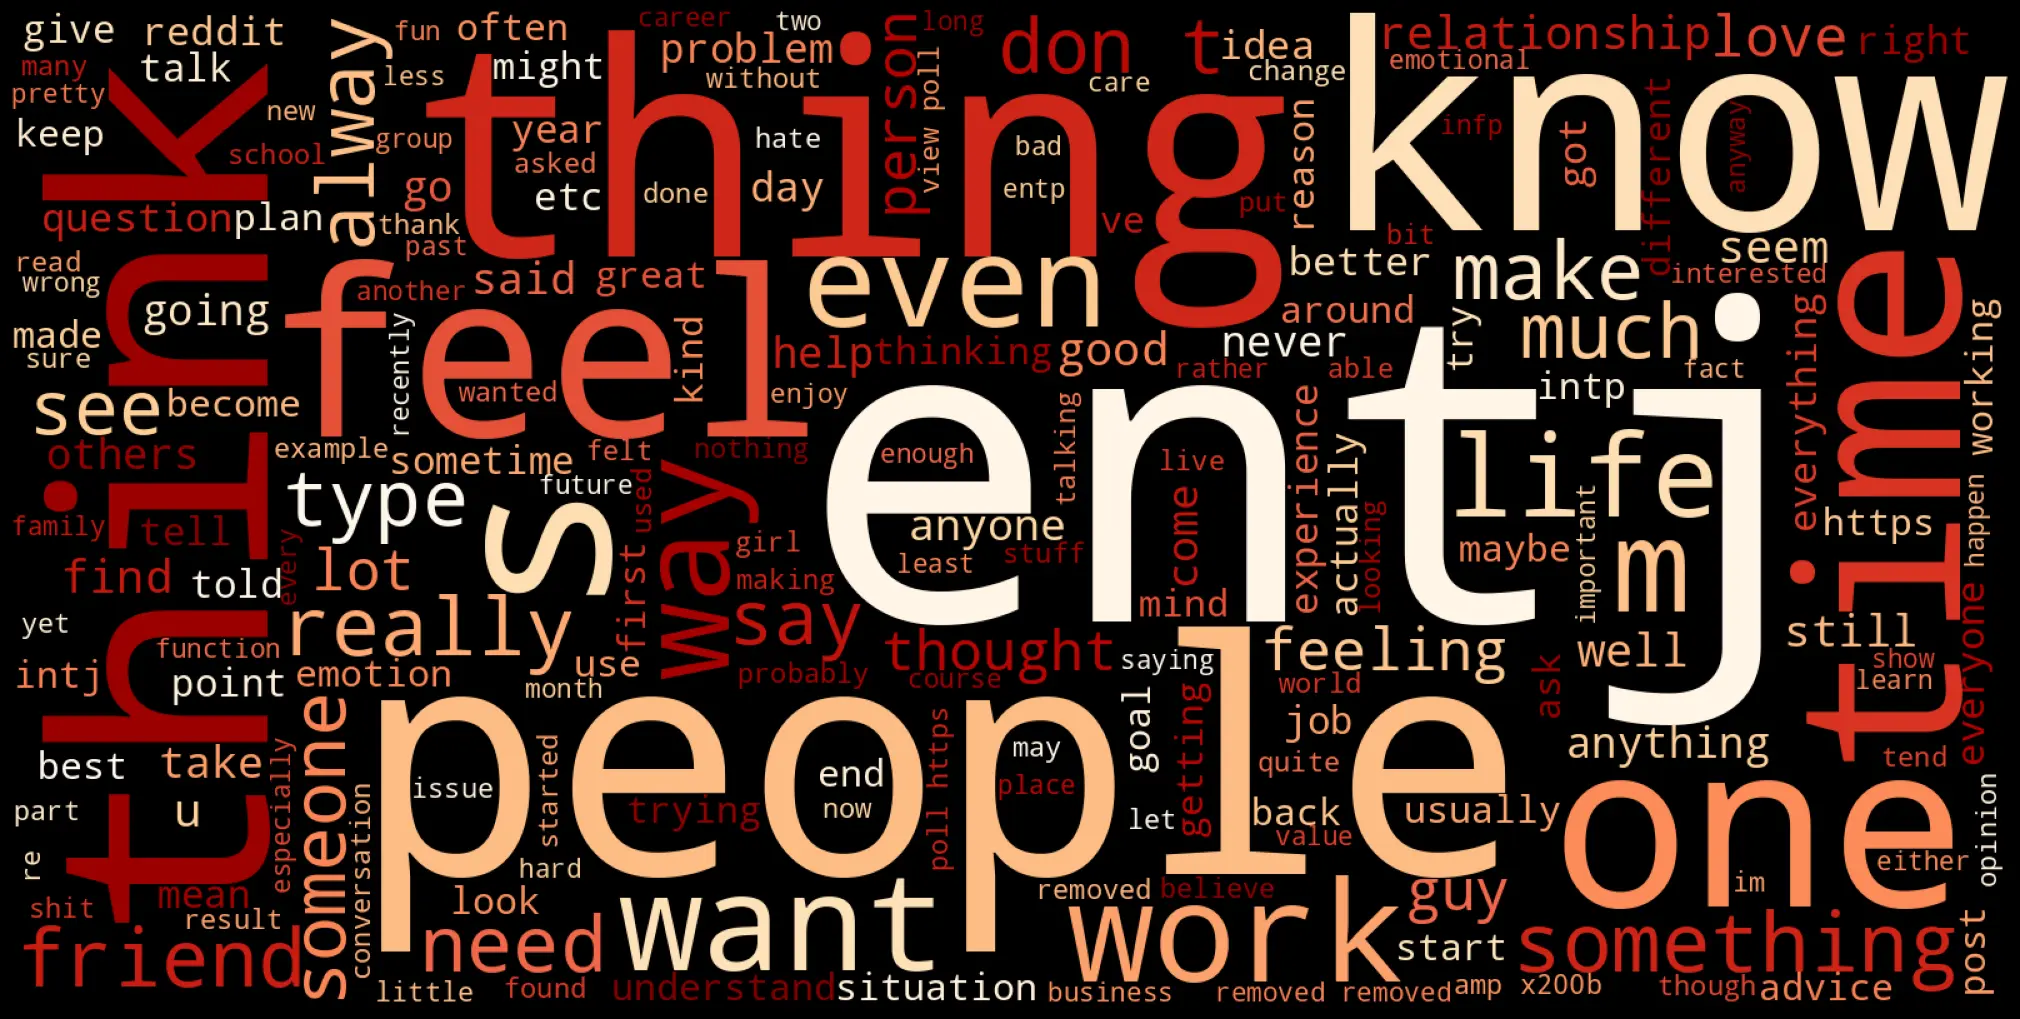
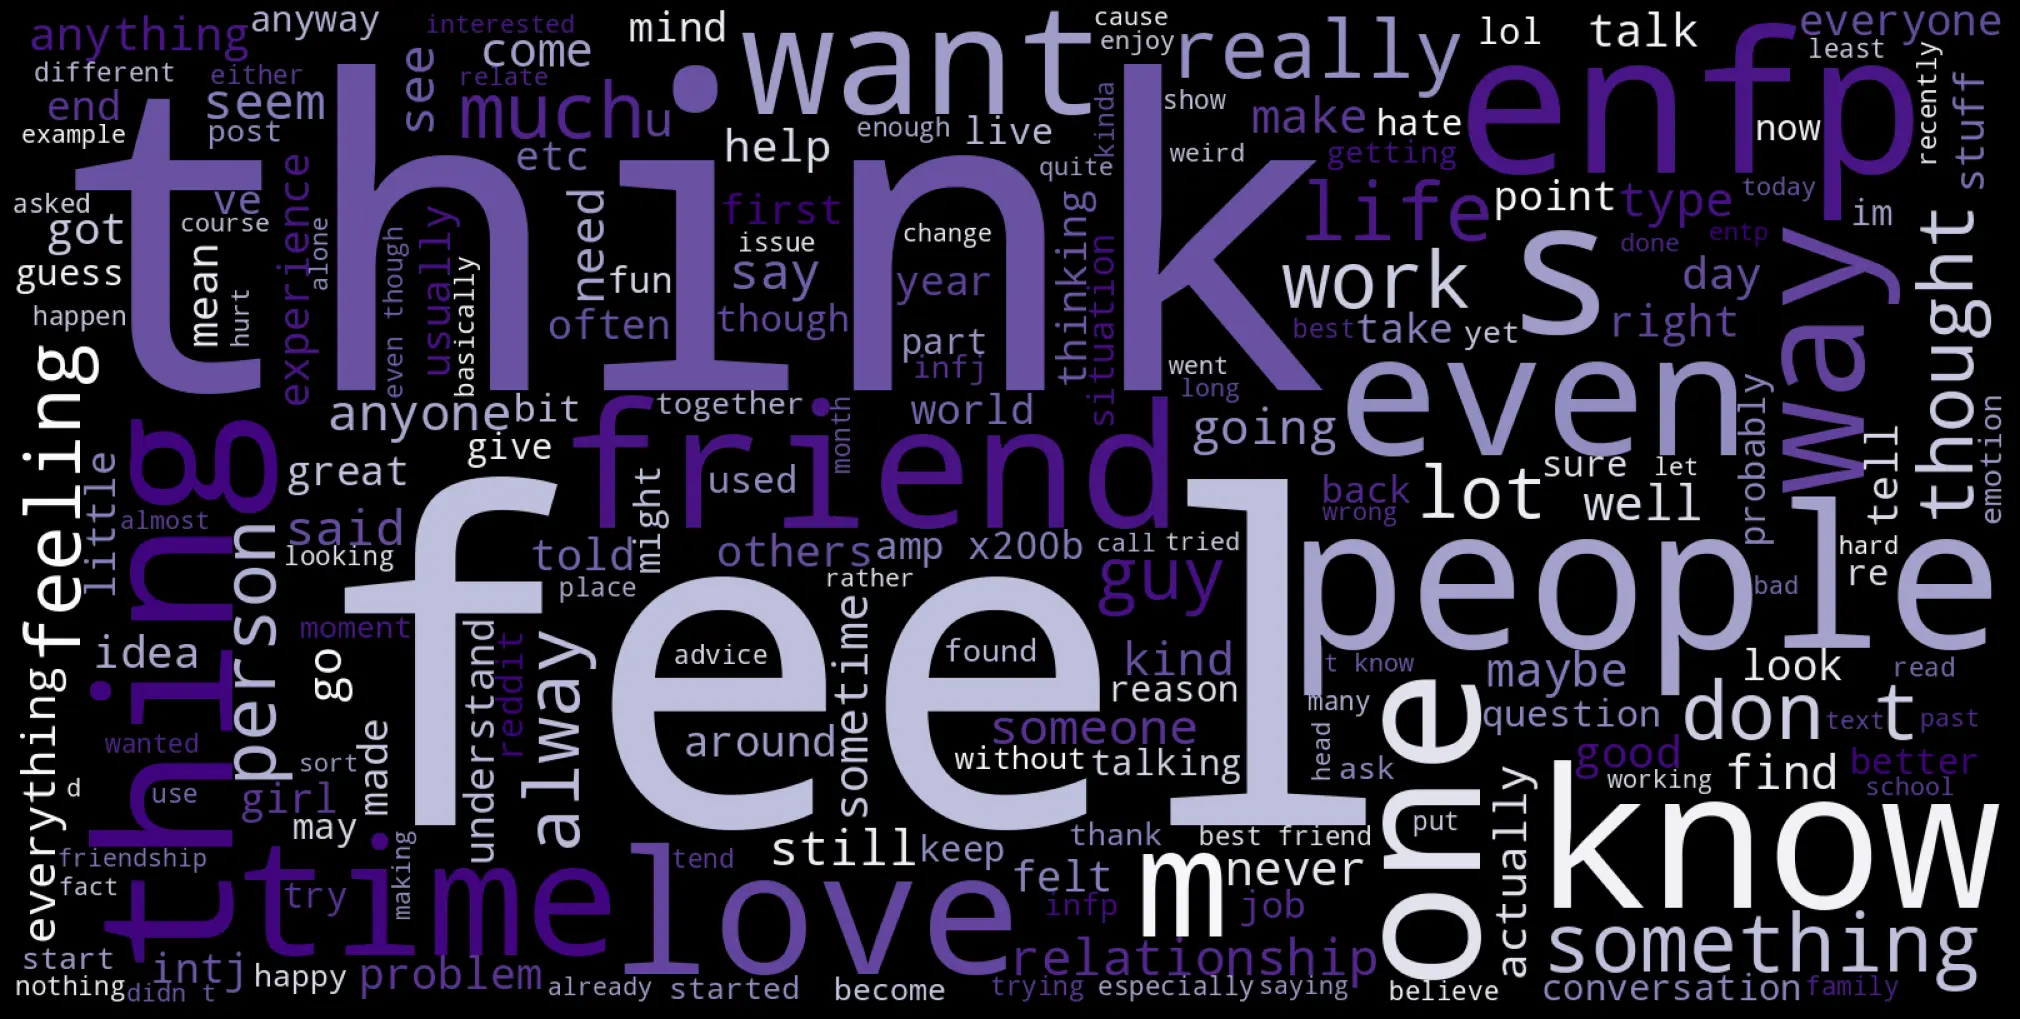
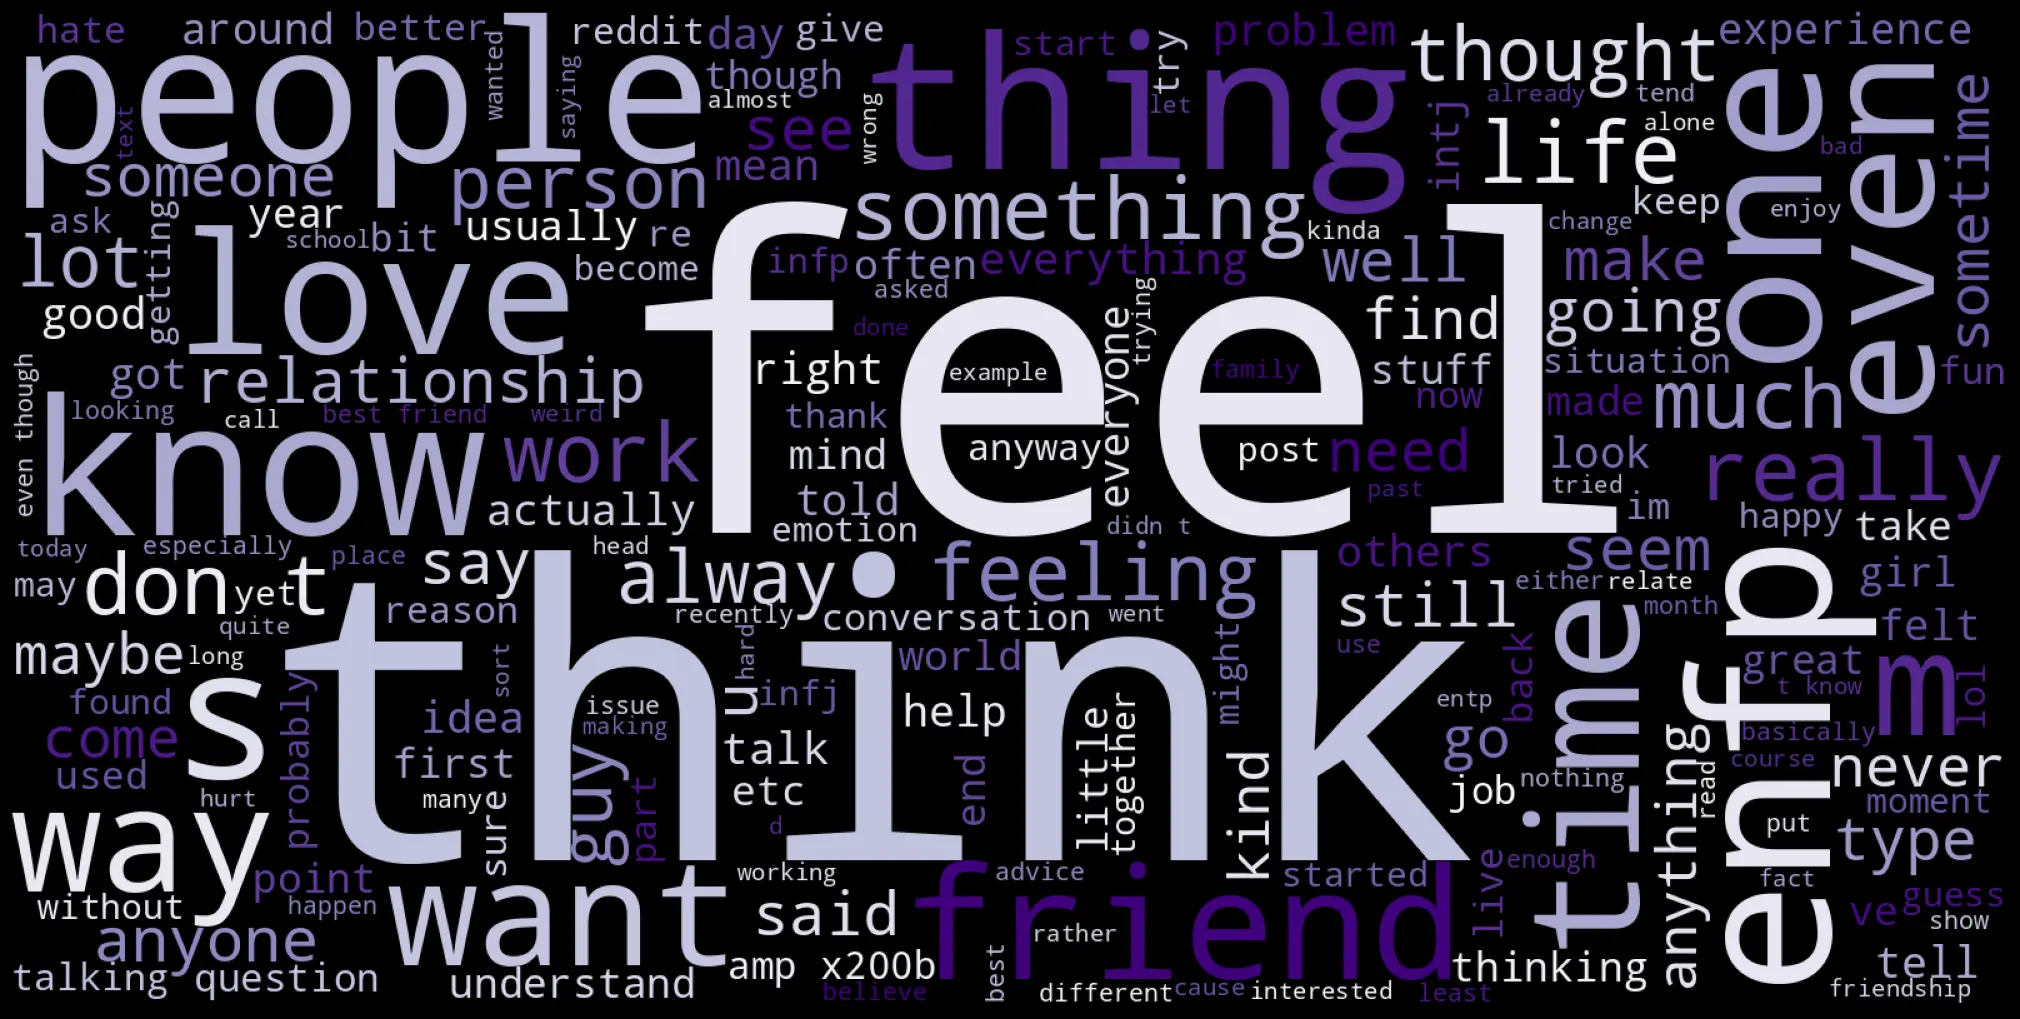
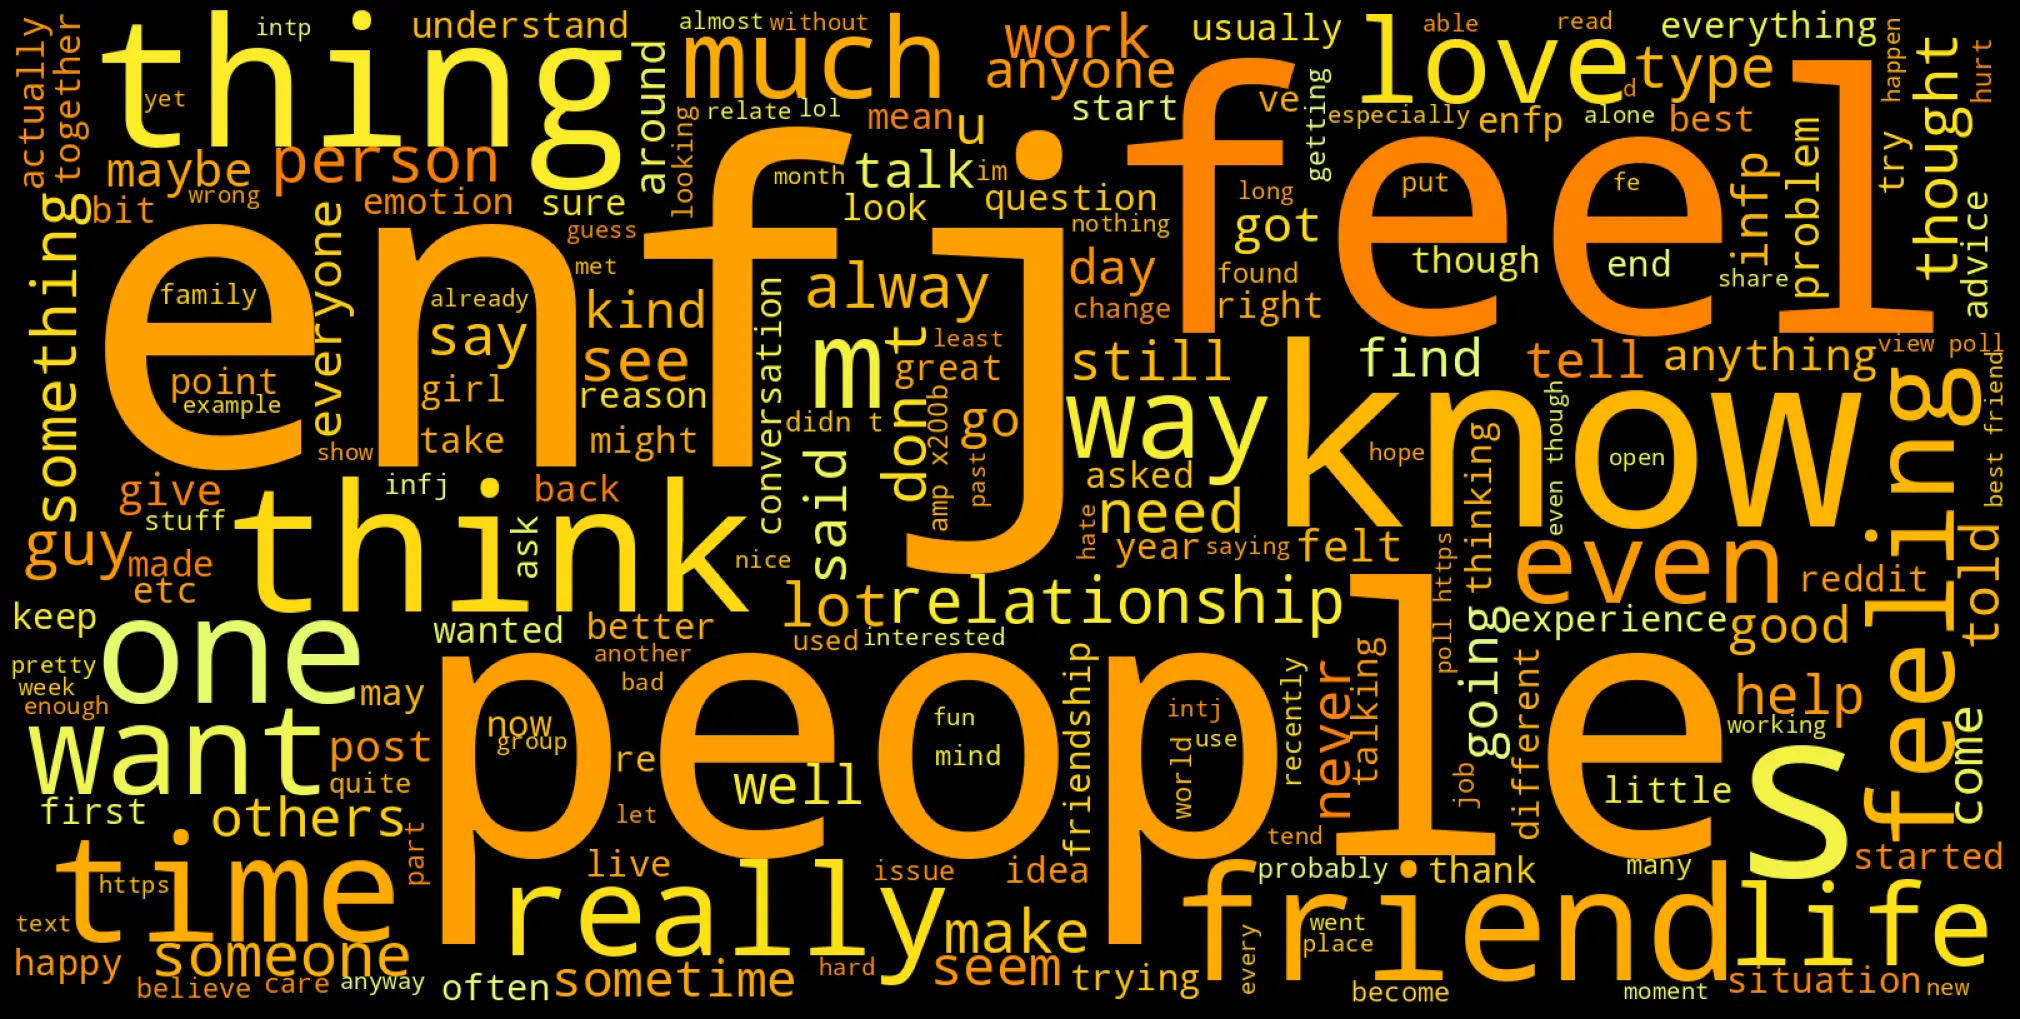
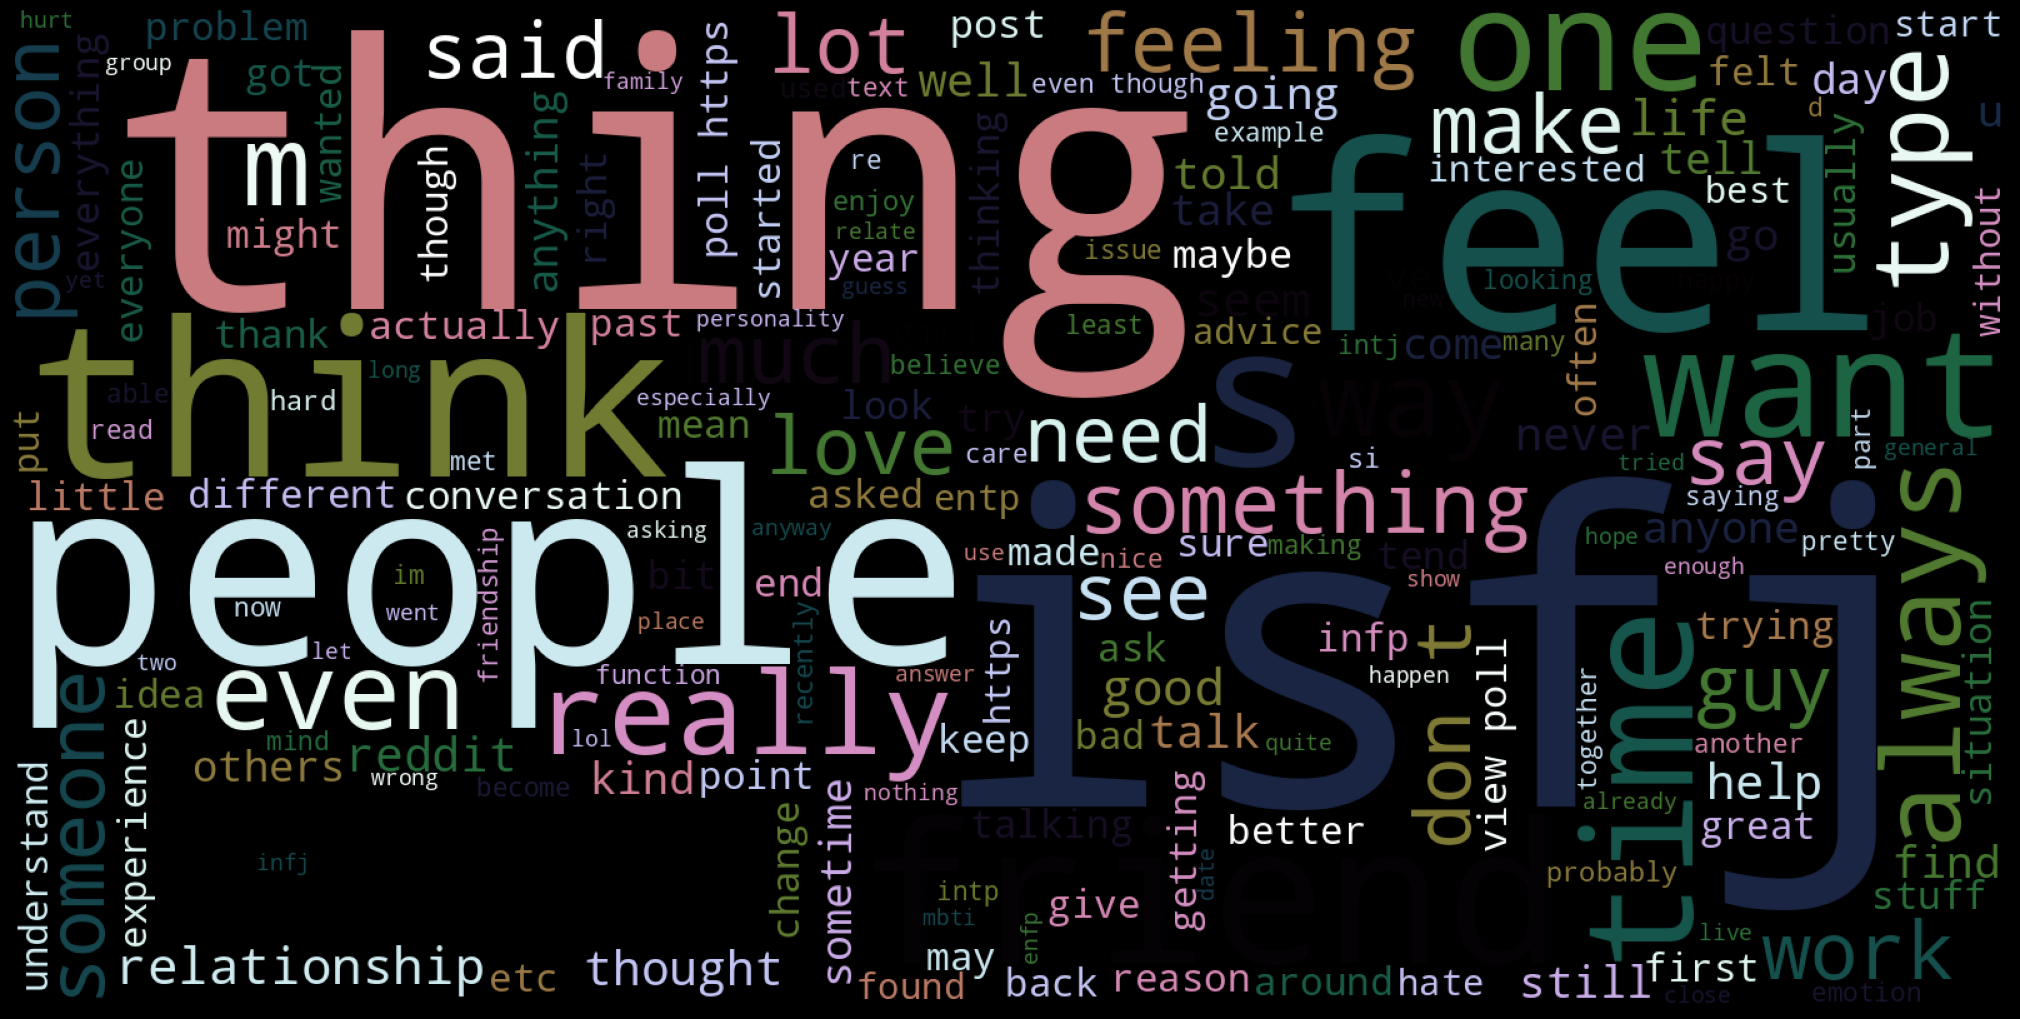
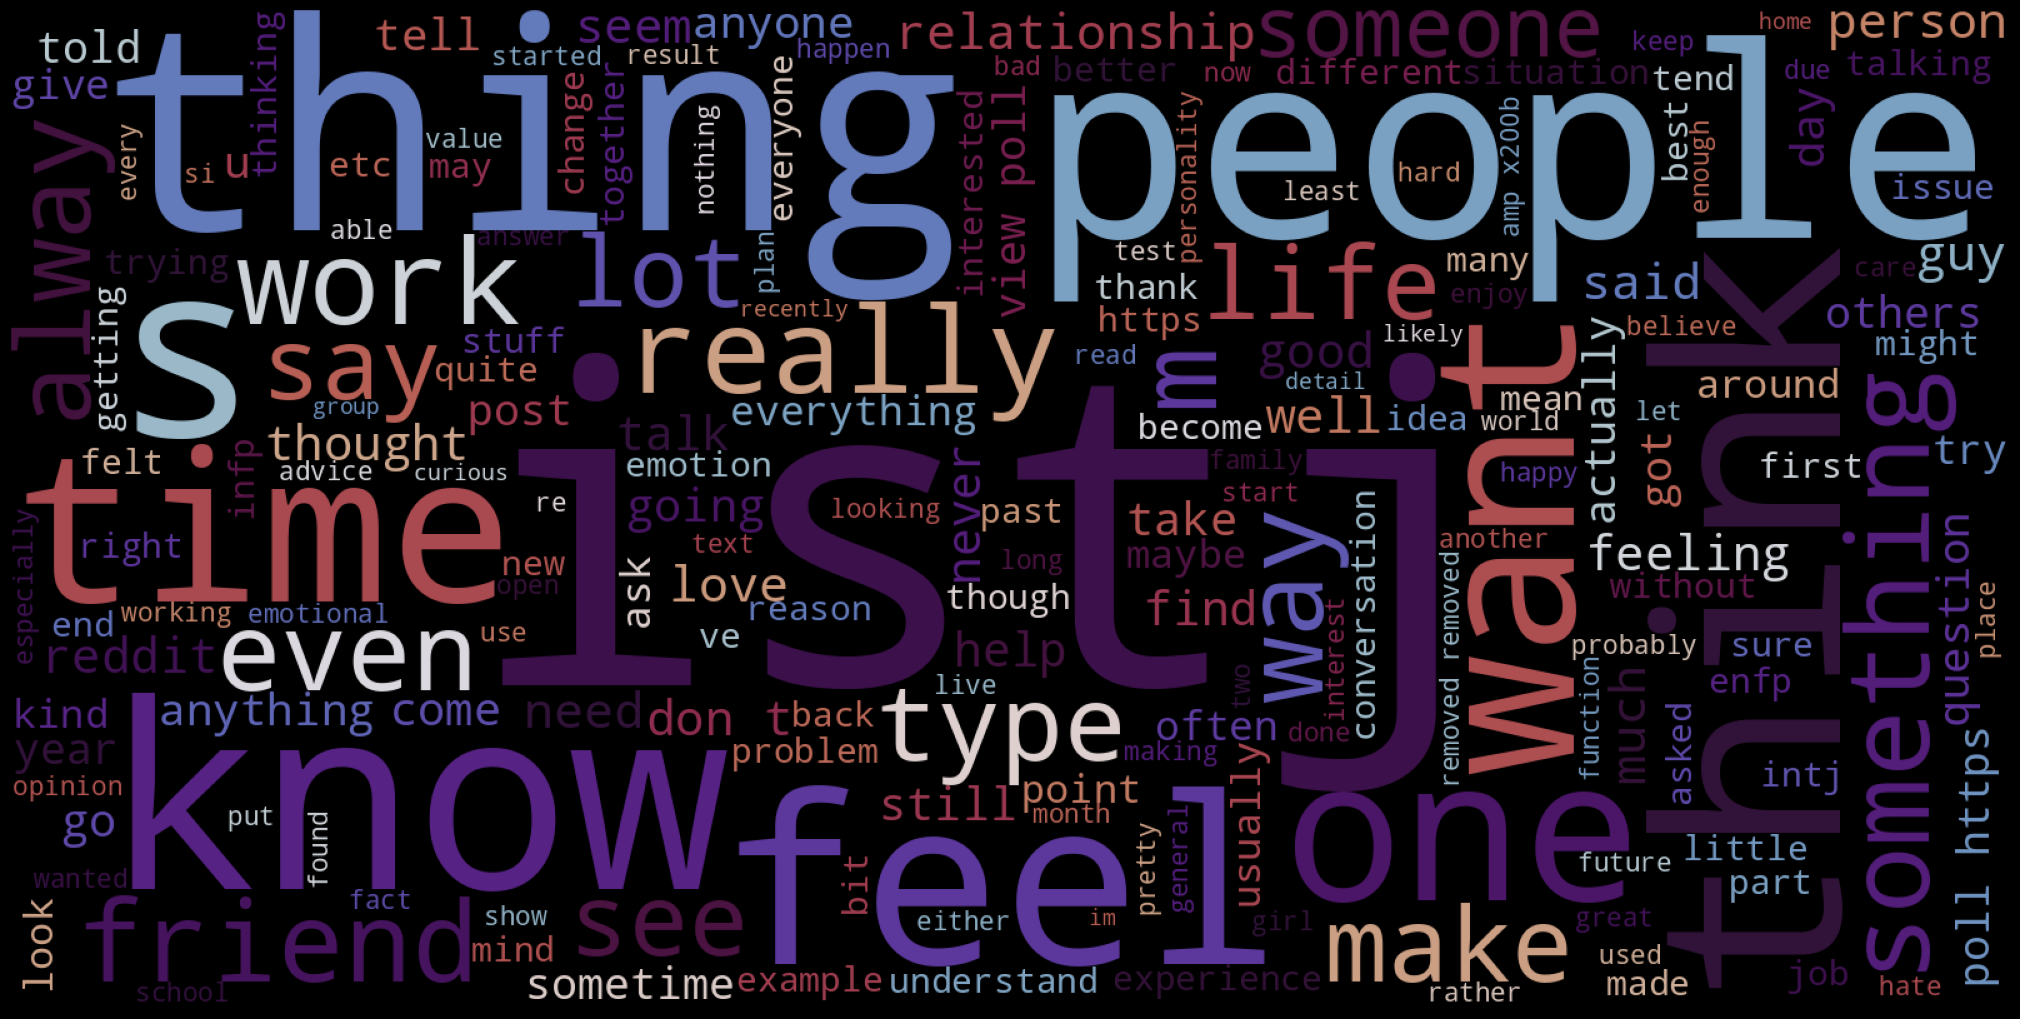
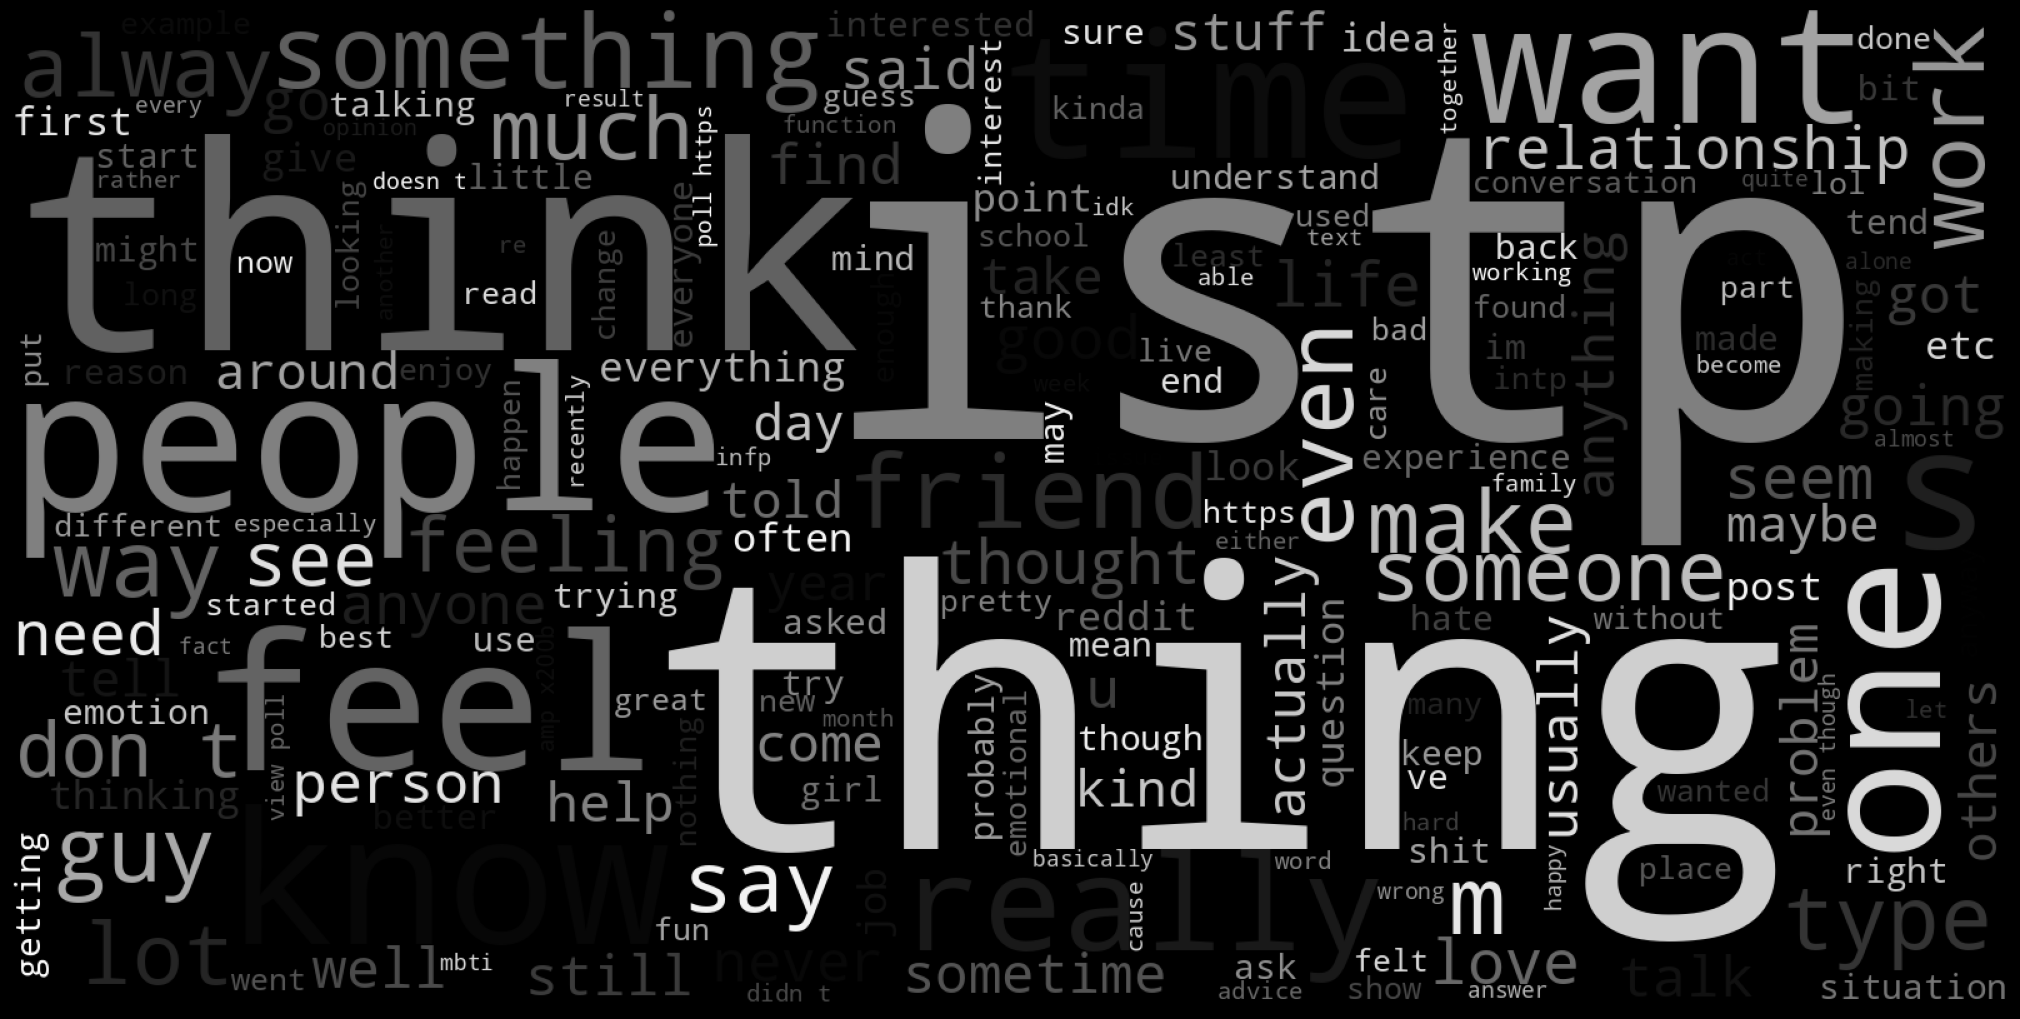
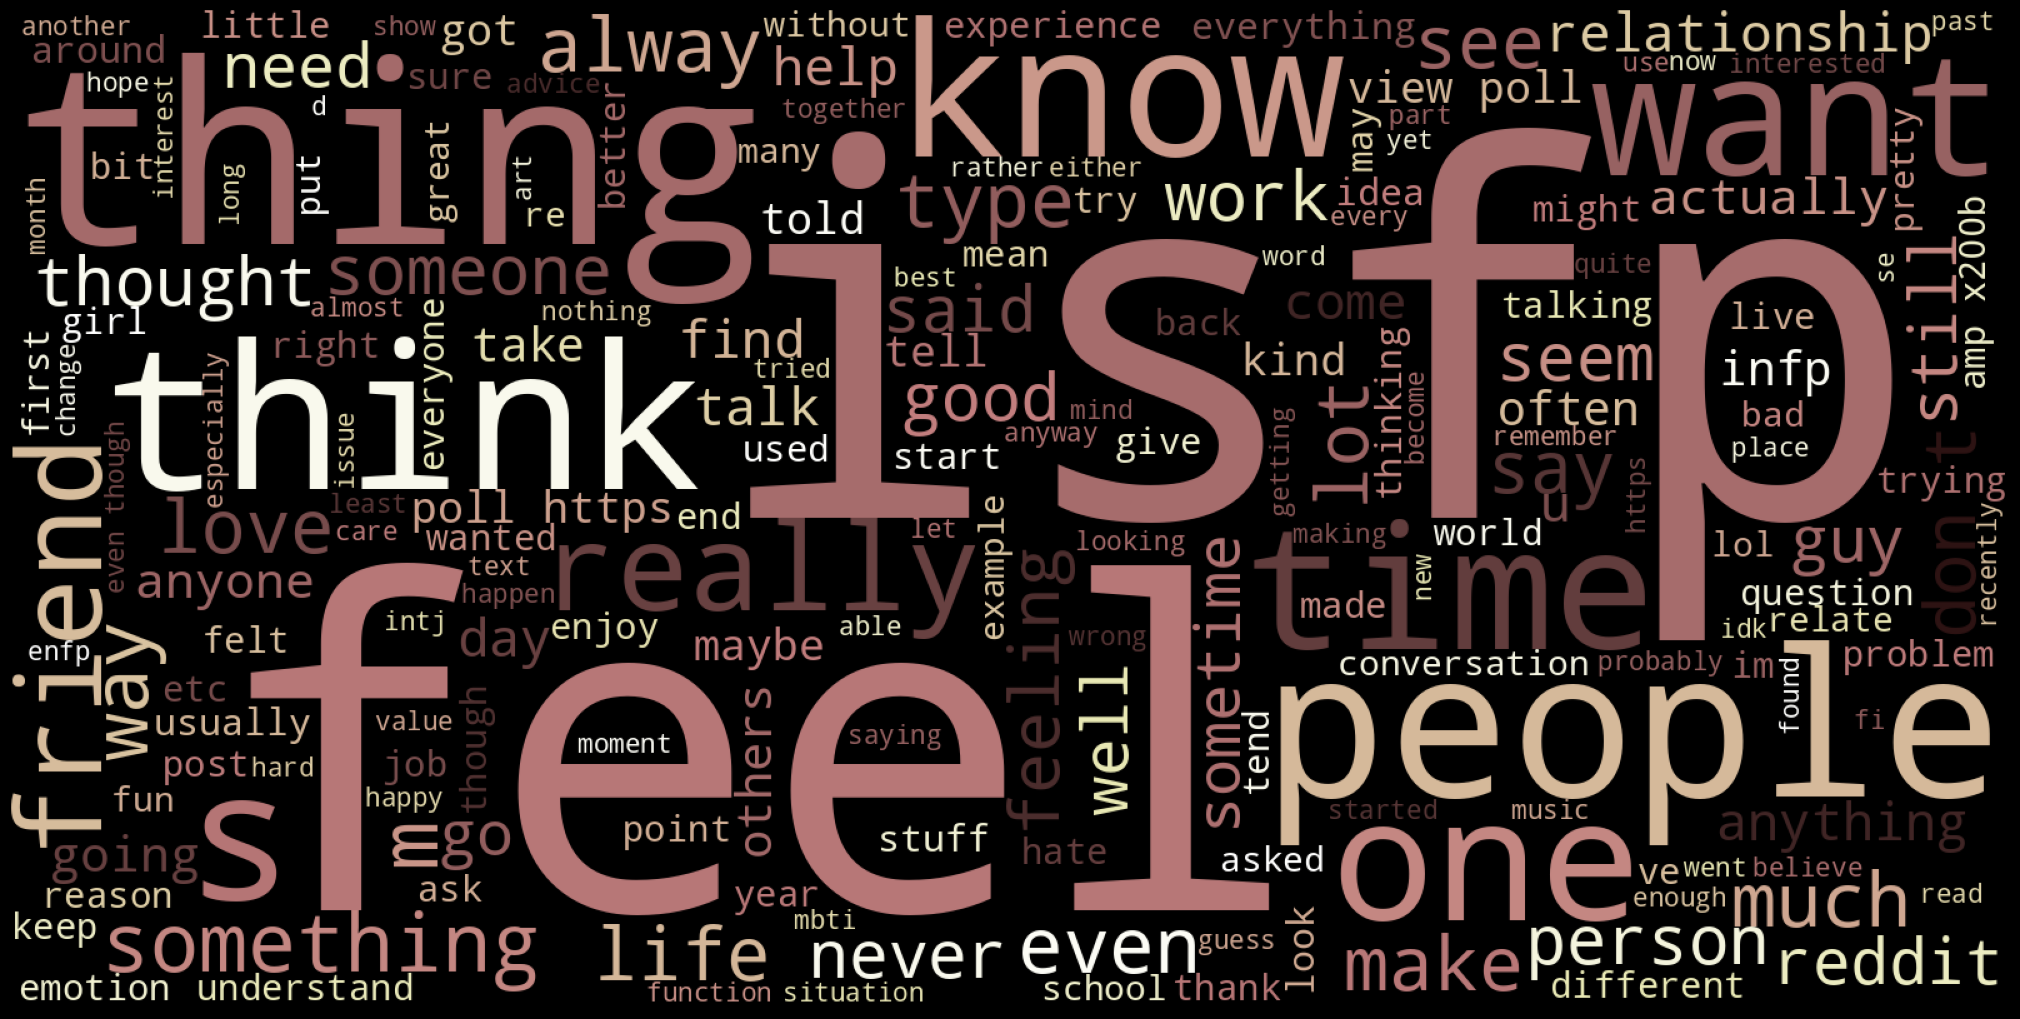
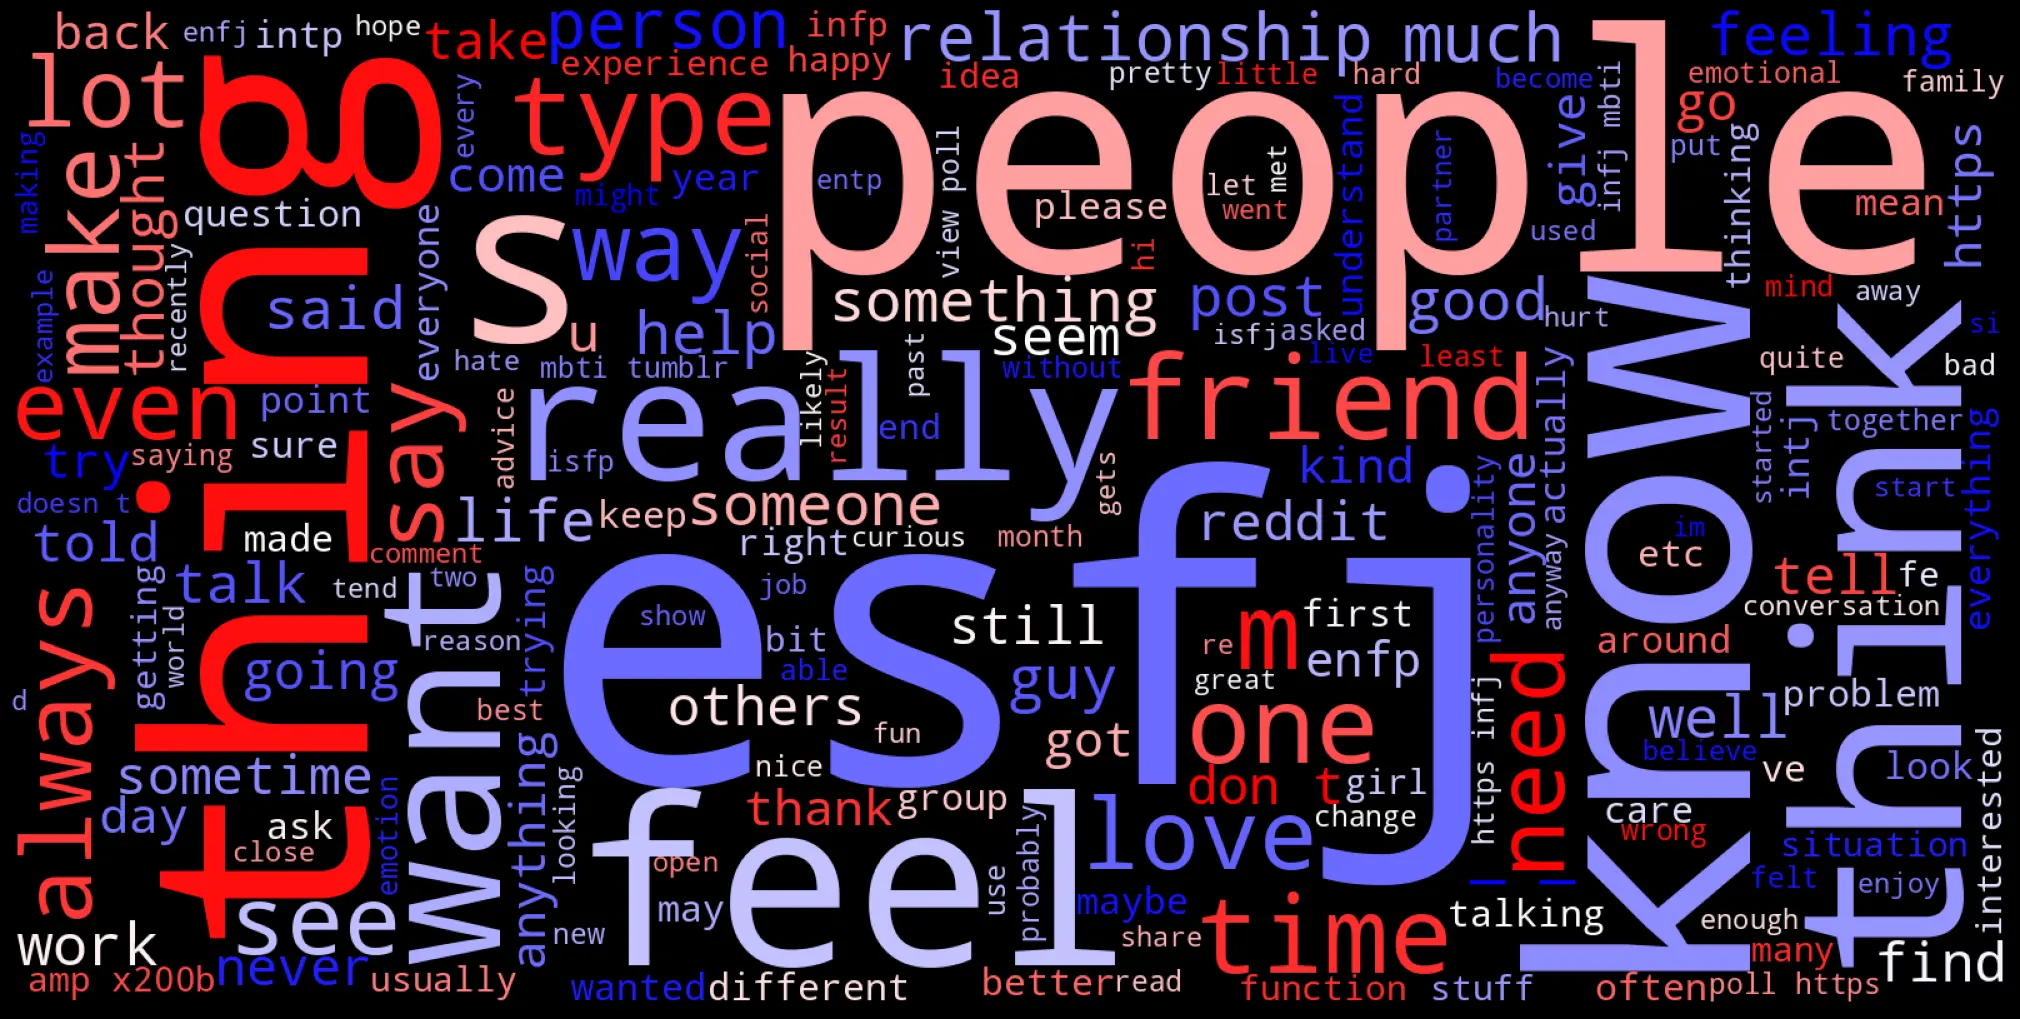
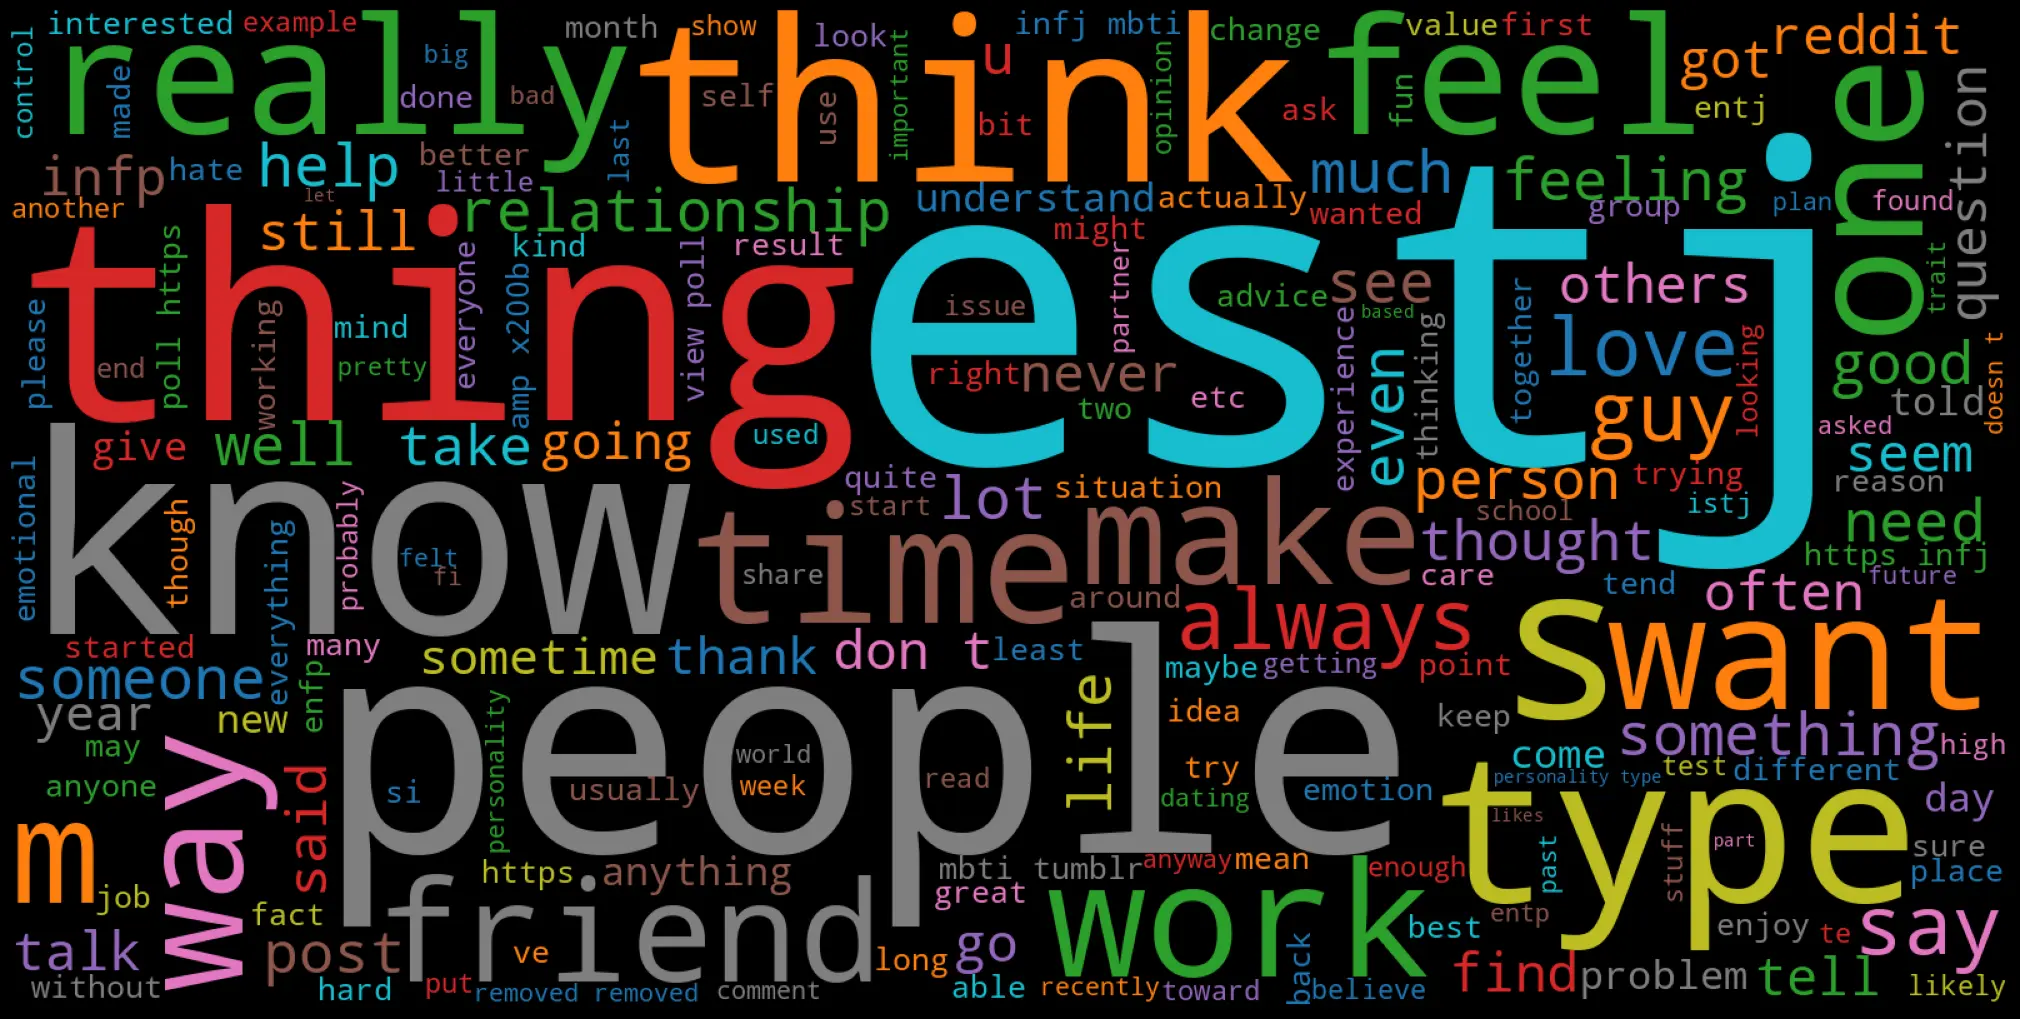
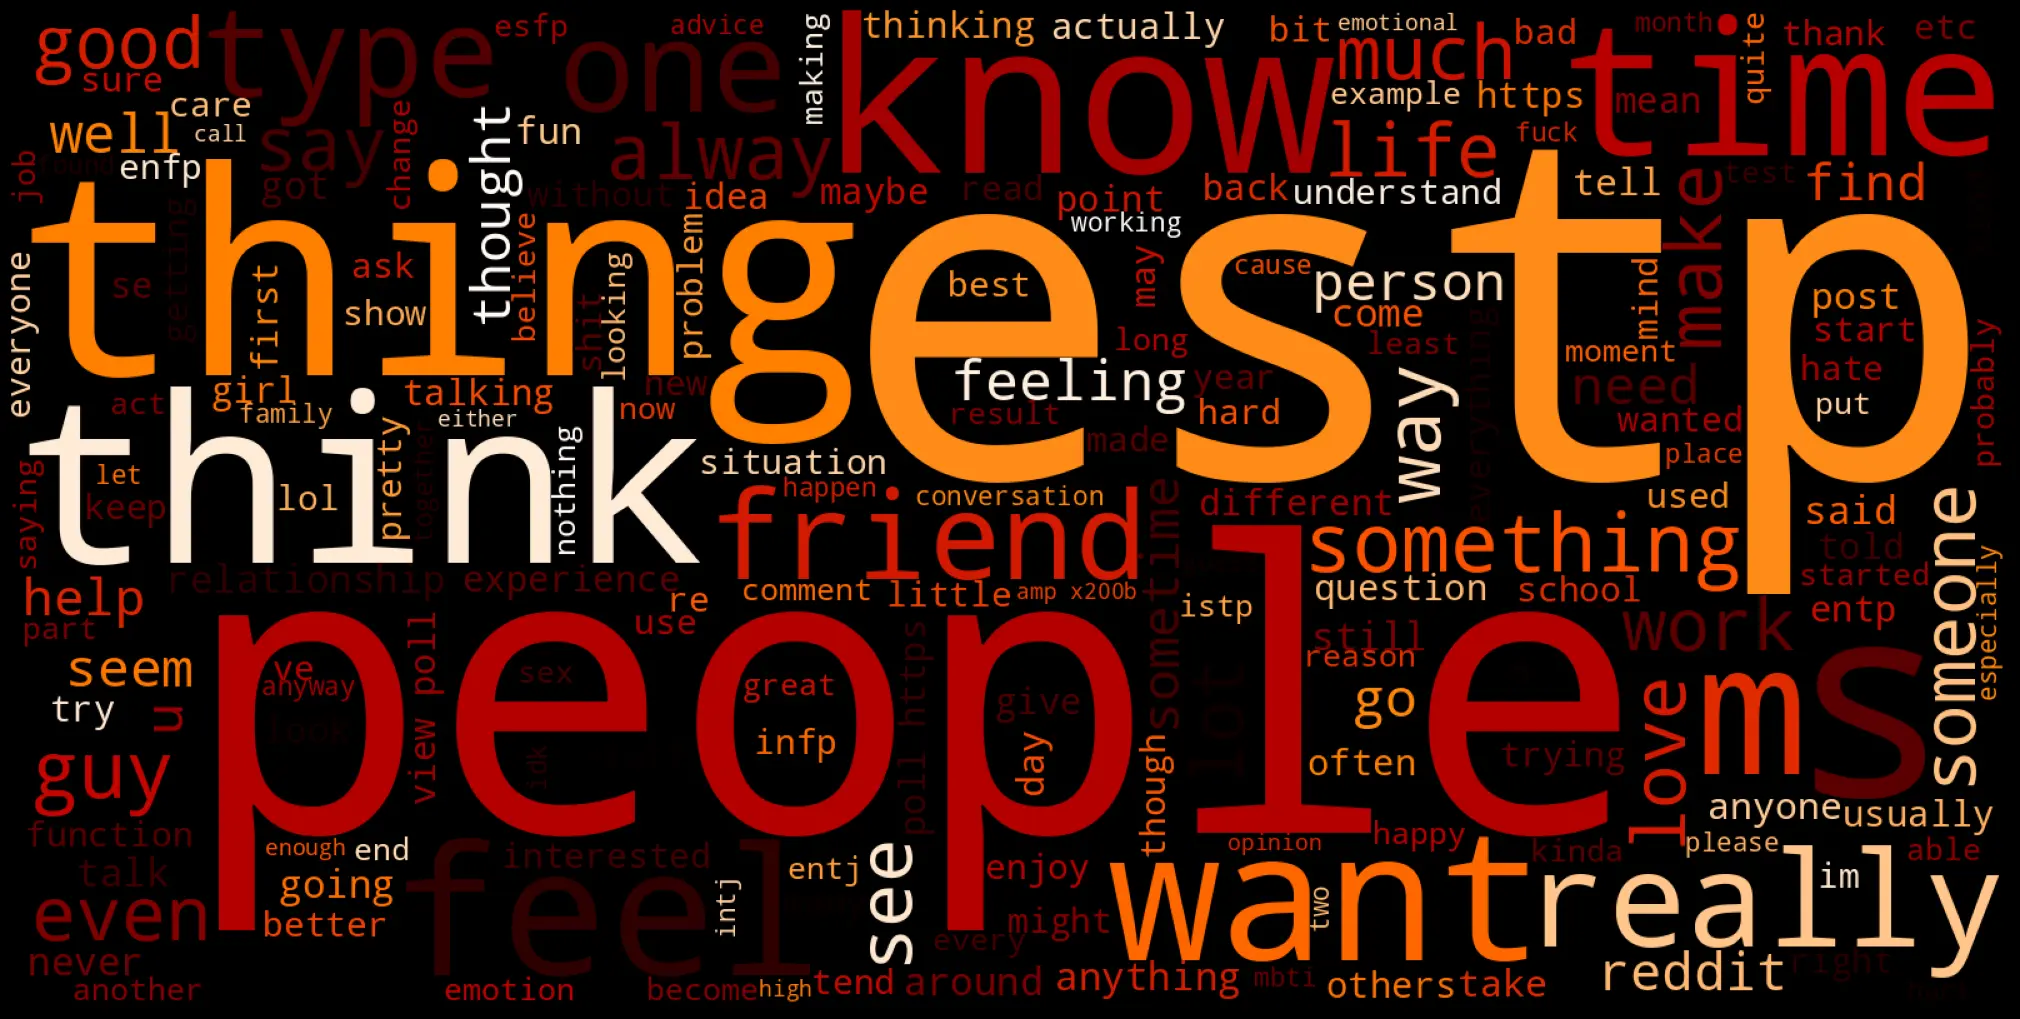
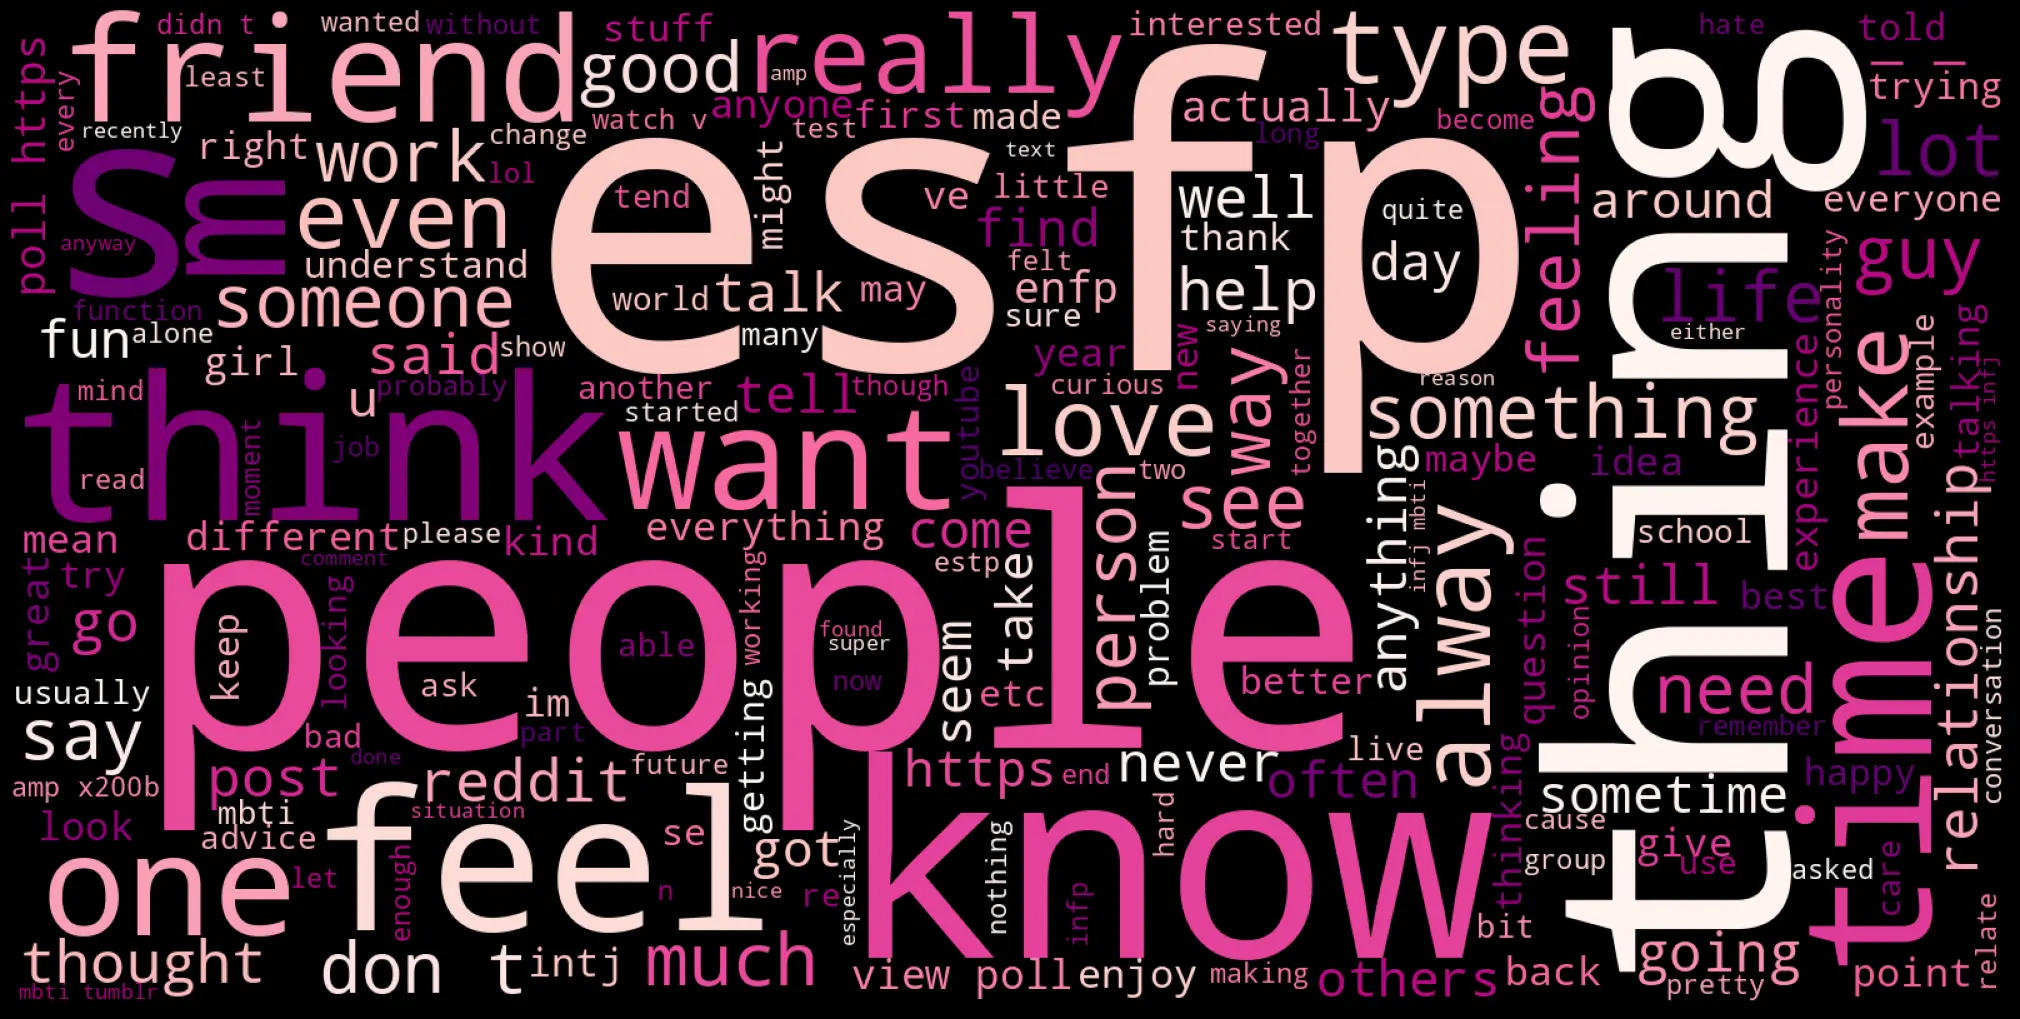
Extra tidbit: I made Word Clouds for each subreddit using the text that I had scraped. I think they turned out really cute!
Conclusion
While it was not the goal of this study to arrive at a definitive conclusion, it was interesting to approach the topic from a data analysis perspective and observe any similarities between my prior knowledge, expectations, and results.
If you have any questions or comments, please do not hesitate to contact me. If you want to deepen the topic, you can have a look at the code and the analyisis on the GitHub respository (and maybe give me a star!).
I hope you enjoyed this exploration and found the interactive graphs engaging. Thank you for reading, and until next time!
Sincerly,
Alessia (an INFJ).